使用Matplotlib的一些奇淫技巧


教你使用Matplotlib画图的一些基础功能之外的奇淫技巧~

前沿

写毕设的过程中需要绘制大量的曲线以及图表,除了一些简单的图用Latex直接绘制之外,大量的曲线图还是要交给Matplotlib,其实也不能说是奇淫技巧,只是一些功能的总结罢了。一是为自己以后画图方便参考,二也为了大家在画图的过程中节省一些Google的时间

一、坐标轴相关操作

Matplotlib隐藏坐标轴

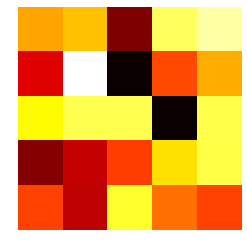
$plt.axis(‘off’)$命令是最靠谱的隐藏坐标轴的方法。

1
2
3
4
5
6
7
from numpy import random
import matplotlib.pyplot as plt
data = random.random((5,5))
img = plt.imshow(data, interpolation='nearest')
img.set_cmap('hot')
plt.axis('off')
plt.savefig("test.png", bbox_inches='tight')

m1

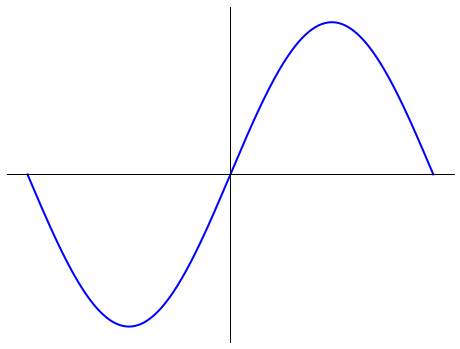
另一种方法是通过分别调整坐标轴刻度范围和边界的显示来使坐标轴隐藏,但这种方法对于colormap的显示有时候会失效。
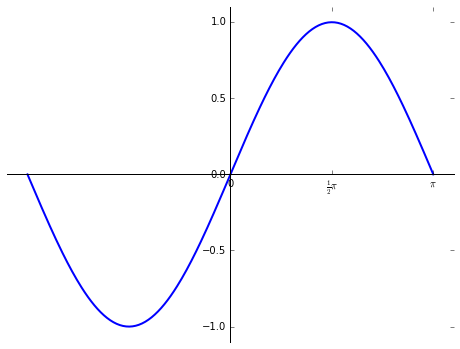
1
2
3
4
5
6
7
8
9
10
11
12
fig = plt.figure()
# 定义子图
ax = fig.add_subplot(111)
# 隐藏坐标轴
ax.set_xticks([])
ax.set_yticks([])
ax.spines['right'].set_color('none')
ax.spines['top'].set_color('none')
ax.spines['bottom'].set_color('none')
ax.spines['left'].set_color('none')
移动坐标轴位置以及调整刻度范围
1
2
3
4
5
6
7
8
9
10
11
12
13
14
15
16
17
18
19
20
21
22
23
24
25
26
27
import numpy as np
import matplotlib
import matplotlib.pyplot as plt
# Data to be represented
X = np.linspace(-np.pi,+np.pi,256)
Y = np.sin(X)
# Actual plotting
fig = plt.figure(figsize=(8,6), dpi=72,facecolor="white")
ax = plt.subplot(111)
ax.plot(X,Y, color = 'blue', linewidth=2, linestyle="-")
# 设置x轴和y轴的范围
ax.set_xlim(1.1*X.min(),1.1*X.max())
ax.set_ylim(1.1*Y.min(),1.1*Y.max())
# 隐藏上坐标轴和右边的坐标轴边界
ax.spines['right'].set_color('none')
ax.spines['top'].set_color('none')
# 将左边和下面的坐标轴移动到x, y坐标的零位置处
ax.spines['bottom'].set_position(('data',0))
ax.spines['left'].set_position(('data',0))
# 设置坐标轴的刻度为空
ax.set_xticks([])
ax.set_yticks([])
plt.show()

m2
修改坐标轴范围以及坐标轴显示刻度
1
2
axes.set_xticks([0., .5*np.pi, np.pi])
axes.set_xticklabels(["0", r"$\frac{1}{2}\pi$",r"$\pi$"])

m3
调整子图之间的间距

使用figure的subplots_adjust方法:

1
2
subplots_adjust(left=None, bottom=None, right=None, top=None,
wspace=None, hspace=None)

其中wspace和hspace控制子图的左右以及上下之间的间距。比如,我可以将他们都设置为0:

1
fig.subplots_adjust(wspace=0, hspace=0)

二、图像的缩放与旋转

缩放与旋转使用的是skimage的transform模块。具体的模块使用方法可以在python交互环境中输入help(transform)来查看
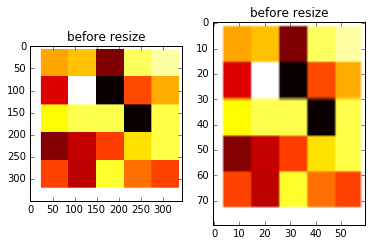
图像尺寸变换
1
2
3
4
5
6
7
8
9
10
11
12
13
14
15
16
# 函数:skimage.transform.resize(image, output_shape)
from skimage import transform,data
import matplotlib.pyplot as plt
img = plt.imread("test.png")
dst=transform.resize(img, (80, 60))
plt.figure('resize')
plt.subplot(121)
plt.title('before resize')
plt.imshow(img,plt.cm.gray)
plt.subplot(122)
plt.title('before resize')
plt.imshow(dst,plt.cm.gray)
plt.show()

m4
其他函数(具体可以在python中使用help命令查看)
  1. 按比例缩放rescale
    函数格式为:
    skimage.transform.rescale(image, scale[, …])
    scale参数可以是单个float数,表示缩放的倍数,也可以是一个float型的tuple,如[0.2,0.5],表示将行列数分开进行缩放。
  1. 旋转 rotate
    skimage.transform.rotate(image, angle[, …],resize=False)
    angle参数是个float类型数,表示旋转的度数
    resize用于控制在旋转时,是否改变大小 ,默认为False。

三、图像保存

函数$plt.savefig()$ 可以将当前图表保存到文件:

1
plt.savefig('haha.png', dpi=400, bbox_inches='tight')

参数:

  • format = png pdf svg ps eps… : 导出的文件格式;
  • dpi:文件的分辨率;
  • facecolor, edgecolor : 图像的背景色 默认是 ‘w’ 白色。

四、读取文件夹下面的多张图片

多张图片的连续读取需要用到os模块。

1
2
3
4
5
6
7
8
9
10
import os
def getAllImages(folder):
assert os.path.exists(folder)
assert os.path.isdir(folder)
imageList = os.listdir(folder)
#pprint.pprint(imageList)
imageList = [os.path.abspath(item) for item in imageList if os.path.isfile(os.path.join(folder, item))]
return imageList
imglist = getAllImages(img_dir)

五、参考文献

  1. 坐标轴:http://stackoverflow.com/questions/9295026/matplotlib-plots-removing-axis-legends-and-white-spaces
  2. 尺度变换:http://blog.csdn.net/wuxinxin559/article/details/46363495
  3. 图片保存:http://staticor.io/post/pydata/pydata-hui-tu-he-ke-shi-hua-1-plt